More than half of the world's stunted children live in Asia.
What might this tell us about population size, nutrition, living conditions and health systems?
Africa: 43%
POPULATION & DEMOGRAPHY · DATA EXPLORER
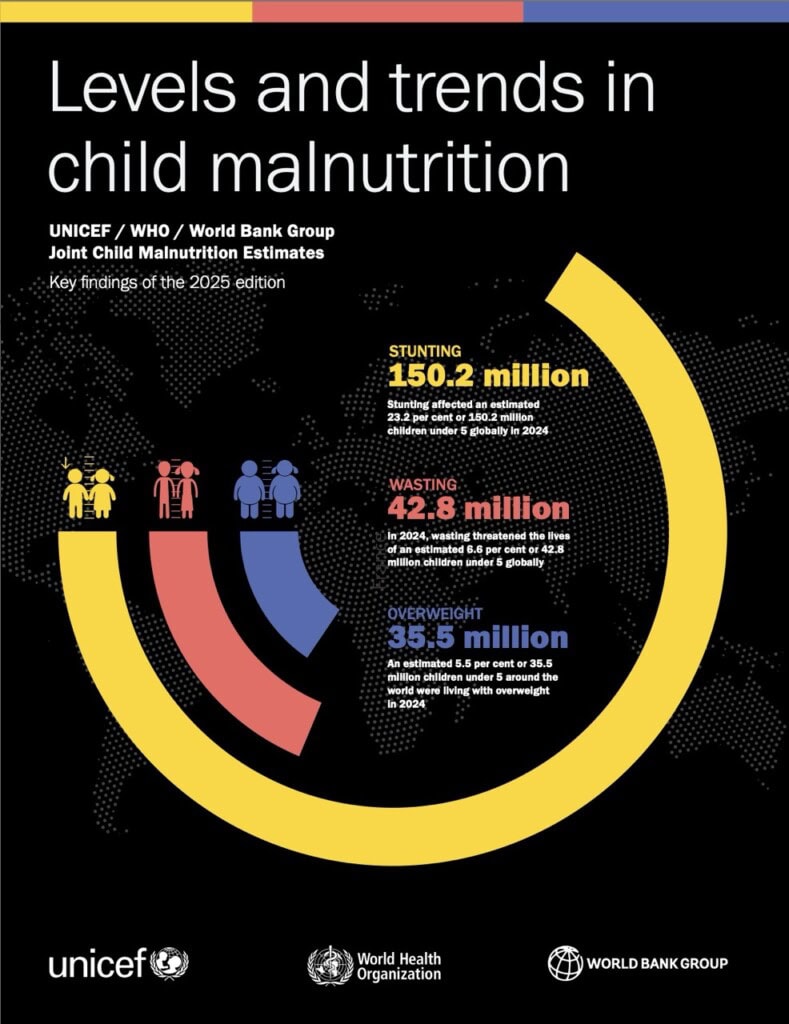
Global health data can tell us not only how many children are affected by malnutrition, but also where those children live. In this exploration, we look at the geographic distribution of stunting, wasting and overweight among children under 5 in 2024.
EXPLORE THE DATA
Stunting, wasting and overweight are different forms of malnutrition. Their global distributions are not identical. Looking carefully at the percentages helps us ask better questions about population size, nutrition, living conditions, food systems and health systems.
More than half of the world's stunted children live in Asia.
What might this tell us about population size, nutrition, living conditions and health systems?
Africa: 43%
Seven out of every ten children affected by wasting globally live in Asia.
Why might wasting have such a different geographic distribution from stunting?
Africa: 27%
Almost half of the world's children affected by overweight live in Asia.
Why can undernutrition and overweight exist in the same region?
Africa: 27%
LOOK CLOSER
Compare the distribution of children affected by the three forms of malnutrition. Notice how the pattern changes depending on the condition.
DATA LITERACY
This is one of the most important ideas in reading global health data correctly.
“Asia 51%” means that 51% of all children under 5 affected by stunting worldwide lived in Asia in 2024.
It does not mean that 51% of children in Asia were stunted. That would require a different denominator.
Always ask: “51% of what?”
THINK BEYOND ONE CONDITION
Yes. A population can experience different forms of malnutrition at the same time. This is sometimes described as the double burden of malnutrition.
The Asia figures provide an opportunity to explore this idea: a large share of the global burden of both stunting and childhood overweight is found in the same broad region.
CHECK YOUR THINKING
Choose the answer that best interprets the information. The questions focus on what the percentages actually mean.
GHE DATA SKILL
A percentage only has meaning when we know what the percentage is a percentage of. The denominator tells us what question the number can answer.
DATA SOURCE
Joint Child Malnutrition Estimates, 2025 edition.
The Joint Child Malnutrition Estimates provide harmonized global and regional estimates of child stunting, wasting and overweight.
REFLECT
Global health is full of percentages. Your job as a data-literate explorer is to pause, identify the denominator, understand the population being described, and then ask what the data can — and cannot — tell you.
Explore the number. Understand the denominator. Ask a better question.