HEALTH & WELLBEING • SUBJECT 2

How healthy are people in different places?

Health is more than the absence of disease. Learn how health can be measured, explore real Canadian data, and discover what differences can teach us about people and communities.

GHE QUESTION What does it mean to be healthy?

A single number cannot tell the whole health story.

LOOK Measure
COMPARE Notice
ASK Question
ACT Respond
YOUR GHE LEARNING PATHWAY
01 Self
→
02 Family & Peers
→
03 Community
→
04 Country
→
05 World
01
START HERE

What does it mean to be healthy?

We often talk about health as if it were a single thing. But health is complex. People can experience different diseases, levels of functioning, access to care, quality of life and length of life.

That is why health researchers use many different measures. Each measure gives us a different piece of the picture.

💡
GHE PRINCIPLE

Health is multidimensional. No single number can tell us everything about the health and wellbeing of a person or population.

MEASURING HEALTH

Six ways to understand health

Health measurement uses different kinds of evidence to understand what is happening to people and populations.

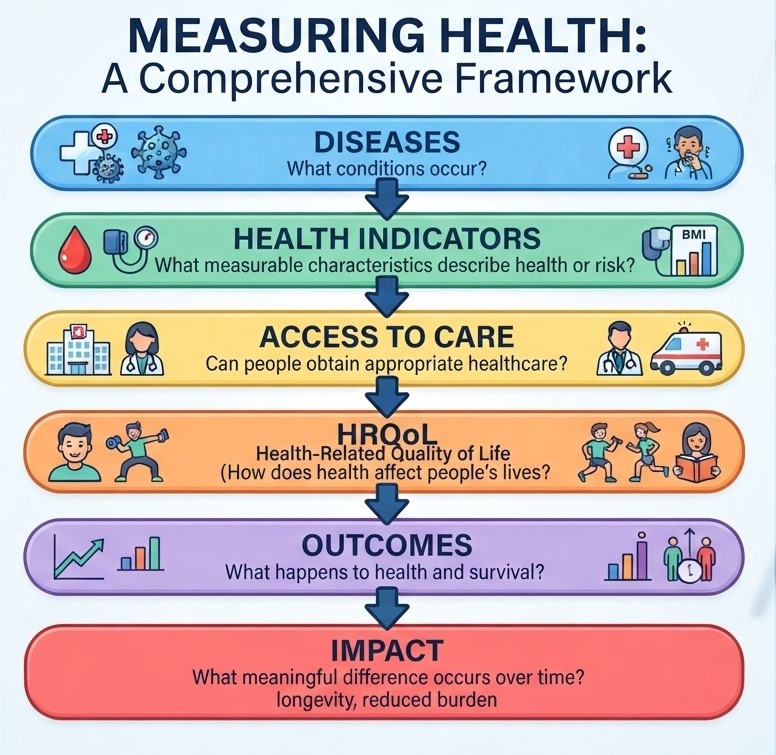
Six categories used to measure health: diseases, health indicators, access to healthcare services, health-related quality of life, outcomes, and impact indicators
01

Diseases & Health Conditions

We can measure how often diseases occur and how many people are affected.

ASK
How much disease is occurring, and among whom?
02

Health Indicators & Measures

Indicators can describe biological, clinical, functional, behavioural or population characteristics.

BMI · Blood pressure · HbA1c · DMFT · Immunization · Physical activity
ASK
What measurable characteristics describe health or risk?
03

Access to Health Services

Access includes more than having a healthcare facility nearby.

Physical · Financial · Social · Cultural · Availability · Acceptability · Quality
ASK
Can people obtain appropriate healthcare when they need it?
04

Health-Related Quality of Life

HRQoL considers how health affects everyday life and participation.

Physical functioning · Mental wellbeing · Pain · Social functioning · Daily activities
ASK
How does health affect how people live, function and participate?
05

Outcomes

Outcomes describe what happens to health, survival, functioning or disease over time.

Mortality · Morbidity · Disability · Premature mortality · Life expectancy
ASK
What ultimately happens to people's health and survival?
06

Impact Indicators

Impact asks whether changes actually make a meaningful difference to people and populations.

Better HALE · Reduced preventable deaths · Reduced disability · Better wellbeing
ASK
Did something actually make a meaningful difference?
A SIMPLE MEASUREMENT JOURNEY
Diseases → Health Indicators → Access → HRQoL → Outcomes → Impact
📊 READ THE DATA

How has life expectancy changed in Canada?

Life expectancy is an important population health outcome. It estimates how long people can expect to live based on mortality patterns.

CANADA 1950 → 2026
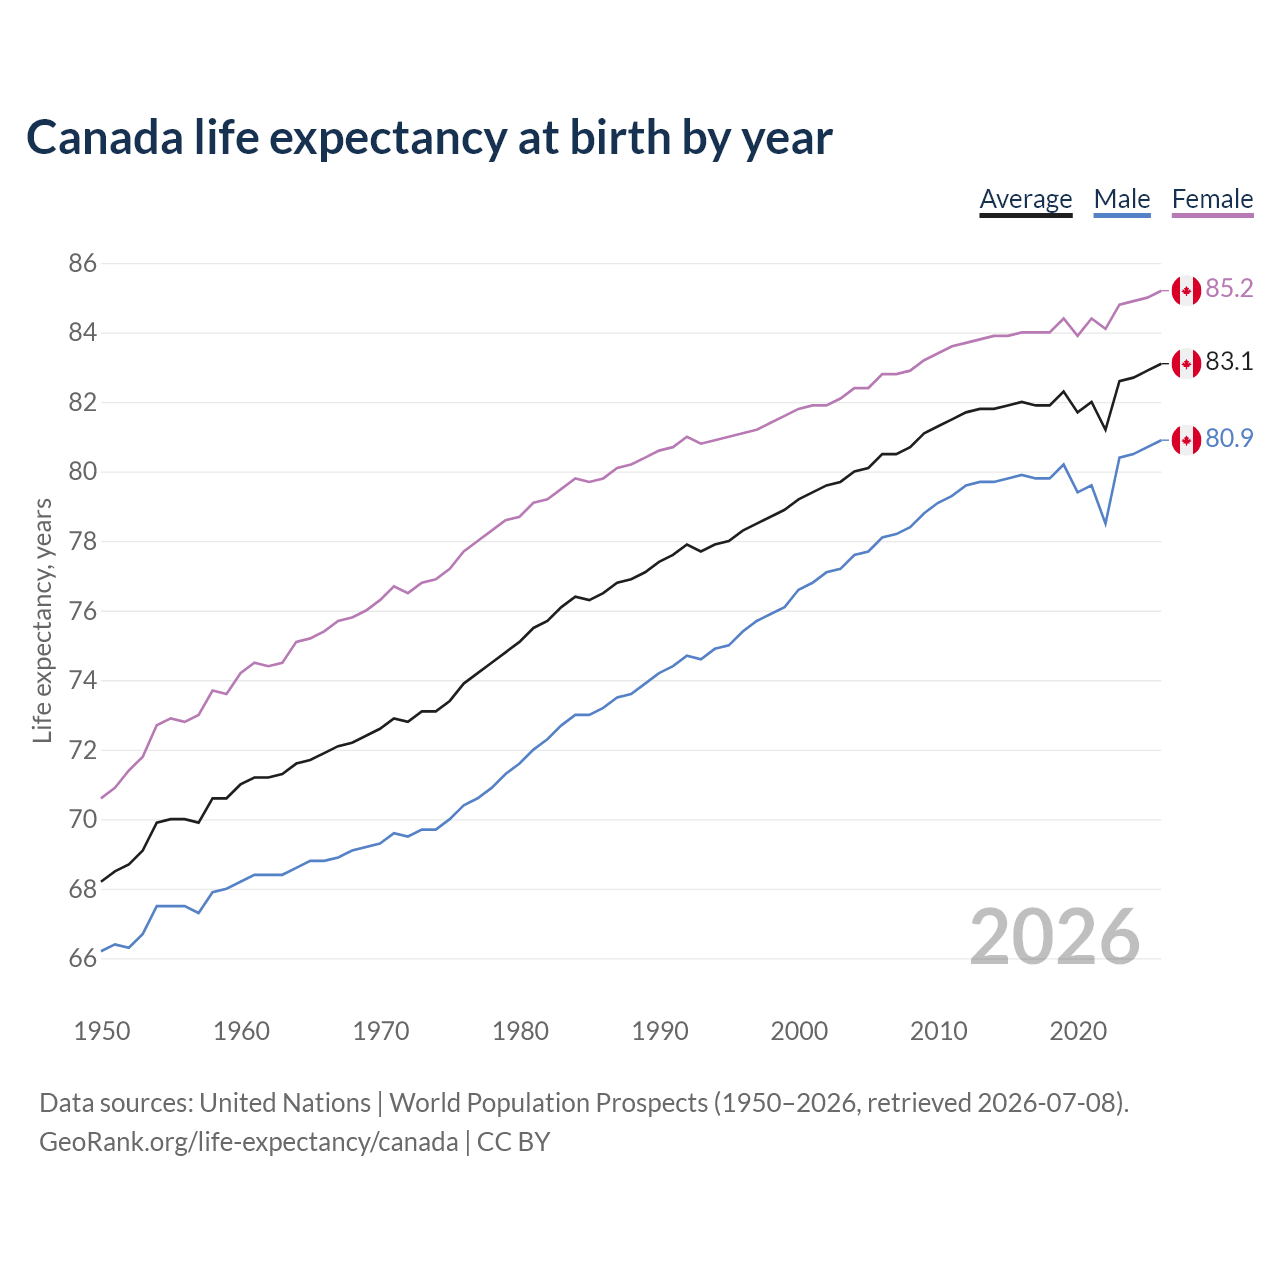
Life expectancy at birth in Canada for males and females from 1950 to 2026
Life expectancy at birth, Canada: 1950–2026 Look for long-term trends, differences between males and females, and unusual changes.
👀 LOOK CLOSELY

What do you notice?

1950 Male ≈ 66 years Female ≈ 71 years
2026 Male ≈ 80.9 years Female ≈ 85.2 years
2026 AVERAGE ≈ 83.1 years Male and female combined
01 What is the overall trend for both males and females from 1950 to 2026?
02 How does female life expectancy compare with male life expectancy?
03 What unusual change do you notice around 2021?
04 Which group appears to show the larger decline around this period?
05 What major event might explain this unusual change?
💡
THINK IT THROUGH

The unusual dip around 2021

The noticeable decline in life expectancy around 2021 is associated with the COVID-19 pandemic and its effects on mortality.

Notice the pattern first. Then use what you know about events and population health to propose an explanation.

LE tells us about LENGTH OF LIFE
+
But what about HEALTHY YEARS?
→
Next: HALE
📊 READ THE DATA

How many of those years are healthy years?

Life expectancy tells us about the length of life. HALE adds another important idea: how many years people can expect to live in good health.

HALE Healthy Life Expectancy

The average number of years a person can expect to live in good health.

LE How long might people live? Length of life
+
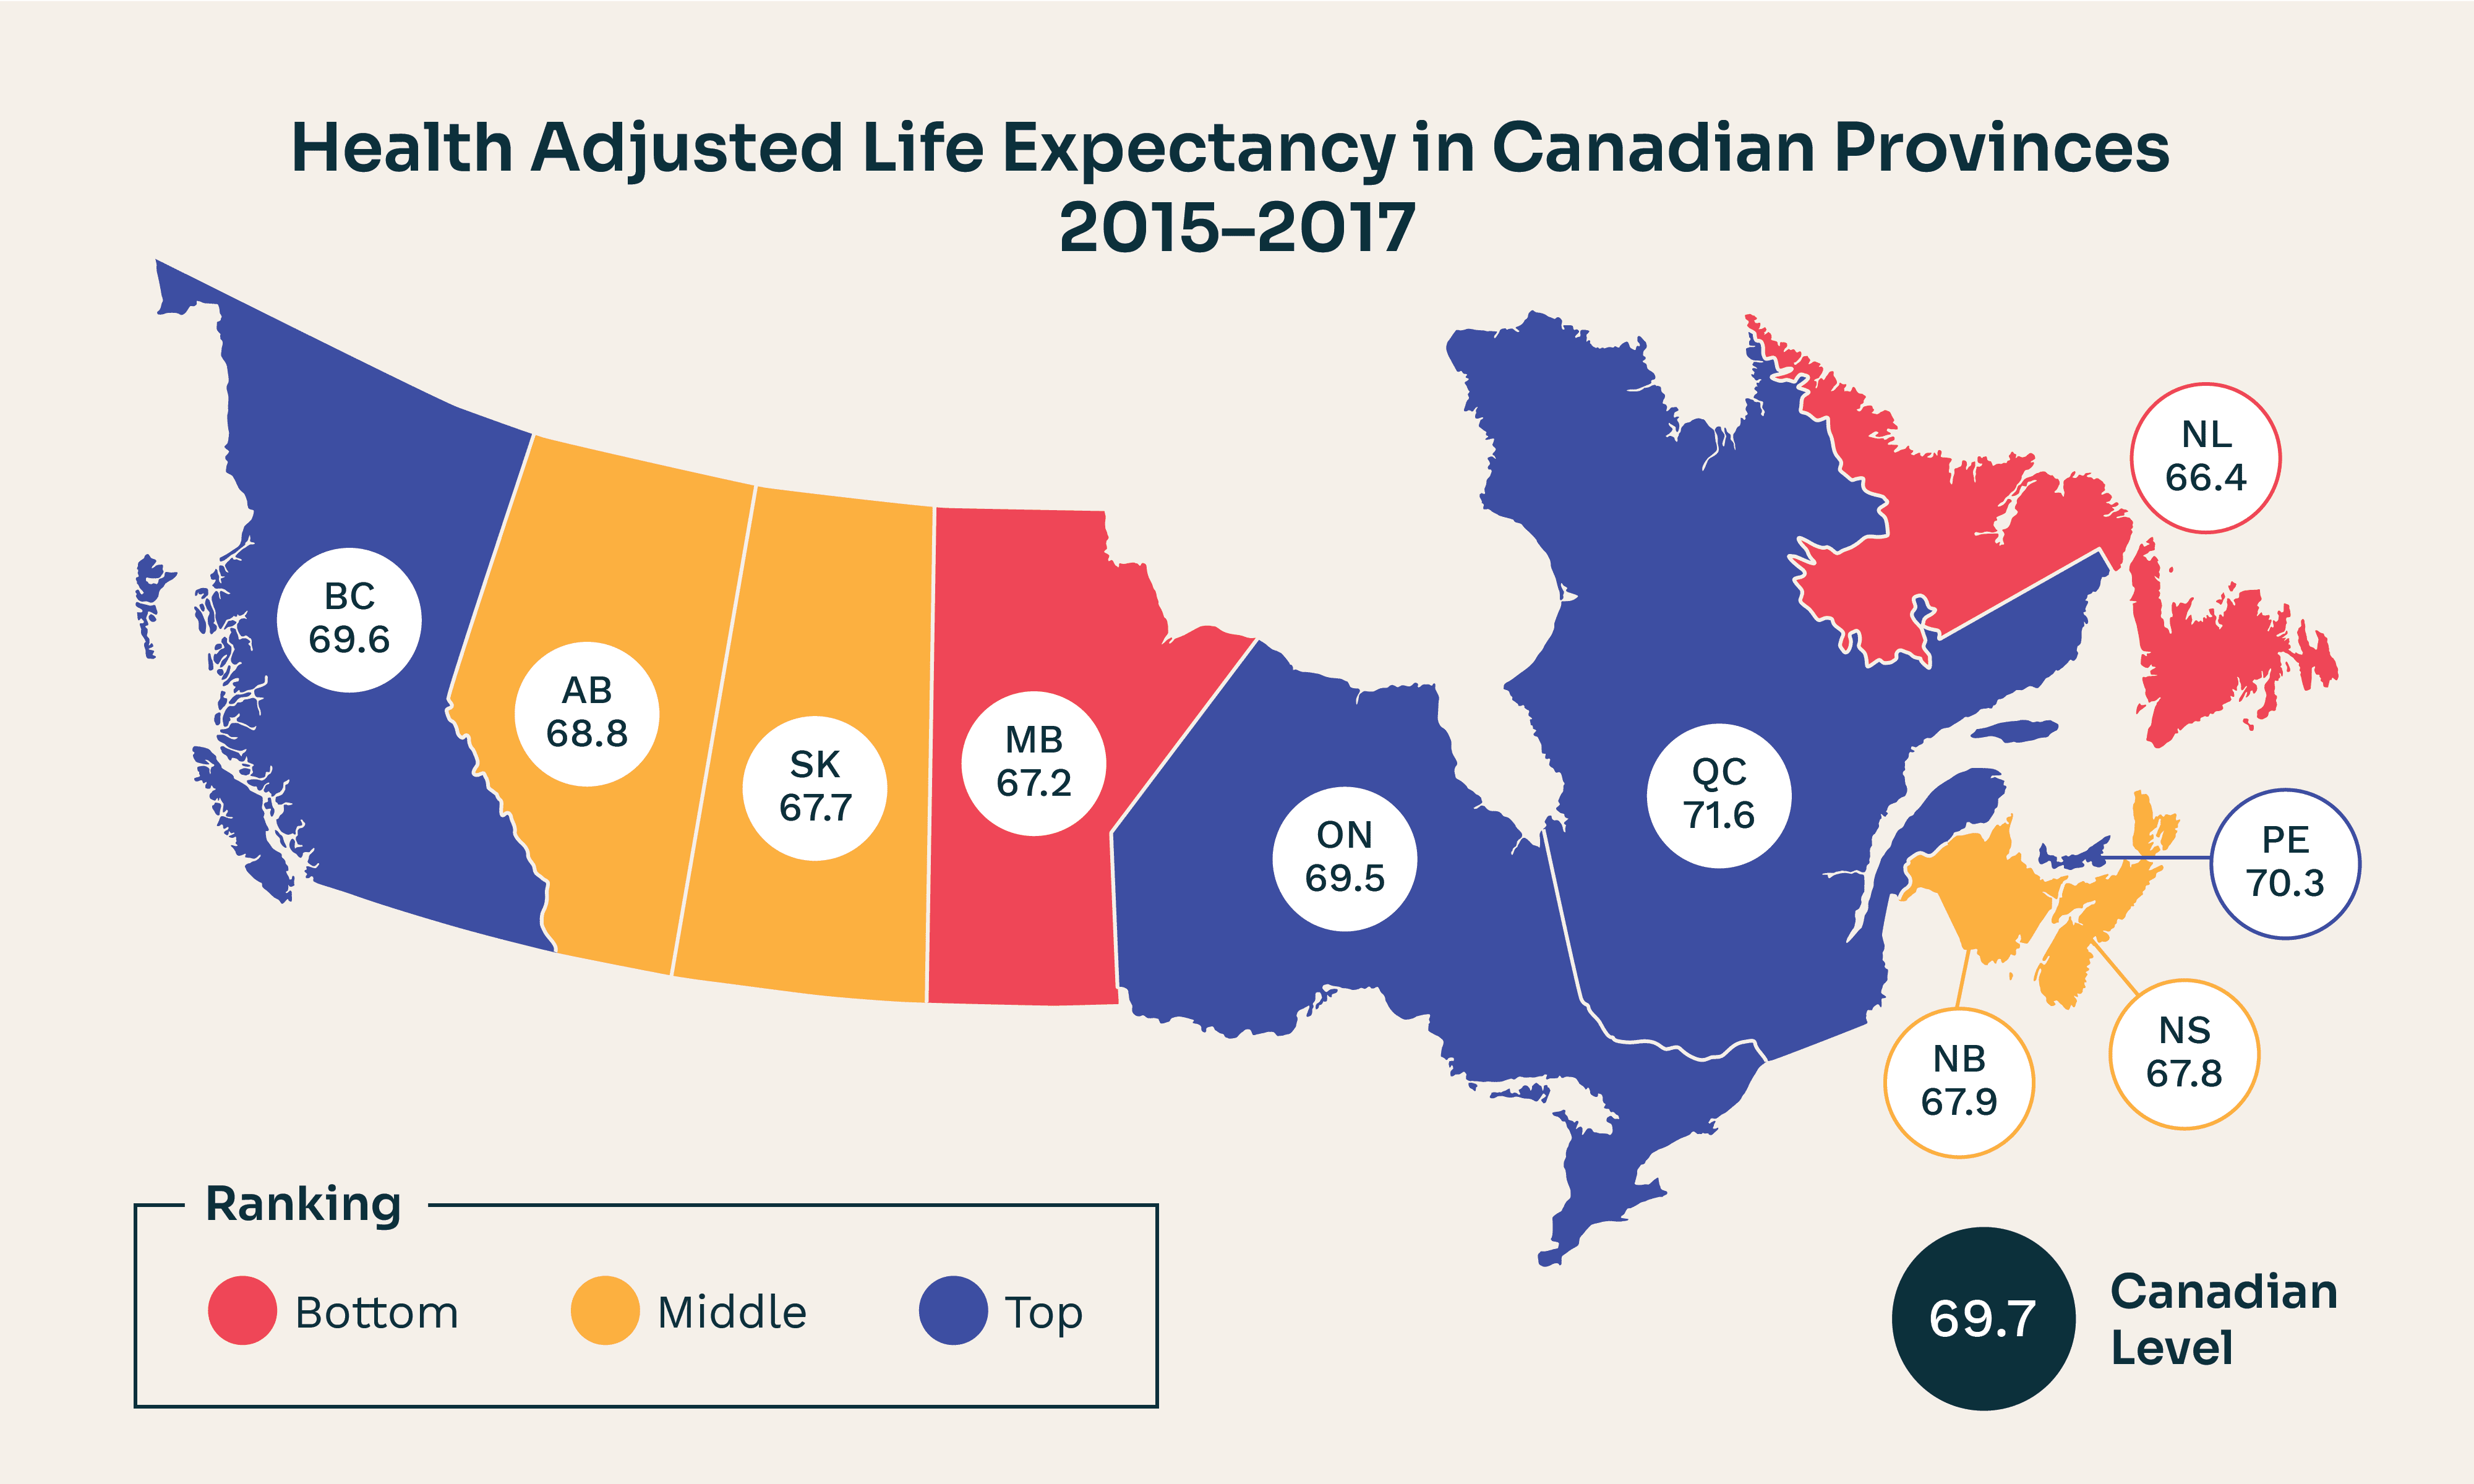
Healthy life expectancy in Canadian provinces, 2015 to 2017
Healthy life expectancy across Canadian provinces, 2015–2017 Compare the values. Then ask what might help explain the differences.
HIGHEST SHOWN Quebec 71.6 years
BRITISH COLUMBIA BC 69.6 years
ONTARIO Ontario 69.5 years
MANITOBA Manitoba 67.2 years
LOWEST SHOWN Newfoundland & Labrador 66.4 years
🔎 NOTICE THE DIFFERENCE

Differences are evidence — not conclusions.

The graph shows measurable differences in HALE between Canadian provinces. But the graph alone does not tell us why those differences exist.

A good global health explorer does not immediately label one population as “healthy” and another as “unhealthy.” Instead, they ask better questions.

ASK: What social, economic, environmental, demographic and healthcare factors might help explain these differences?
IMPORTANT

A population can have a lower HALE than another population while still having a HALE that is substantially higher than a global reference. Always ask: “Compared with what?”

THINK DEEPER

Why might health differ?

Health outcomes are shaped by many interacting determinants.

01 Income & socioeconomic position
02 Education
03 Employment & working conditions
04 Physical environment
05 Social environment & relationships
06 Healthcare access & quality
07 Culture & community
08 Policies & systems
DETERMINANTS → EXPOSURES → ACCESS & OPPORTUNITIES → HEALTH → WELLBEING
CONNECT THE MEASURES

One health problem can appear in many measures

Consider diabetes. A population-health researcher might look at several different parts of the story:

DISEASE Diabetes prevalence
→
INDICATOR Blood glucose / HbA1c
→
ACCESS Prevention & treatment
→
HRQoL Daily functioning
→
OUTCOME Complications & mortality
→
IMPACT Better population health
🌍
SOCIAL DETERMINANTS OF HEALTH

Health differences make us ask why.

Differences in health measures may reflect differences in living conditions, resources, opportunities, environments, social structures and access to care.

The goal is not simply to identify a difference. The goal is to understand the factors behind it.

🎯
SUSTAINABLE DEVELOPMENT GOALS

Better measurement can support better action.

Understanding health and its determinants connects strongly with SDG 3: Good Health and Well-being and also with goals related to poverty, education, inequality, cities, climate and strong institutions.

CHECK YOUR THINKING

Health & Wellbeing Challenge

Some questions test concepts. Others ask you to read the graphs carefully.

12 questions Score: 0 / 12
Q1
REFER TO: MEASURING HEALTH IMAGE

Which statement best explains why we use several different measures to understand health?

Q2
REFER TO: MEASURING HEALTH IMAGE

Which question is most directly answered by measuring the prevalence of a disease?

Q3
REFER TO: MEASURING HEALTH IMAGE

Which of the following is an example of a health indicator?

Q4
REFER TO: MEASURING HEALTH IMAGE

A community has a hospital nearby, but some people cannot afford the services and others face cultural or social barriers. What does this example show?

Q5
📊 REFER TO: LE CANADA 1950–2026 GRAPH

Looking at the graph, what is the main long-term pattern in life expectancy in Canada from 1950 to 2026?

Q6
📊 REFER TO: LE CANADA 1950–2026 GRAPH

According to the graph, approximately how did female and male life expectancy compare in 2026?

Q7
📊 REFER TO: LE CANADA 1950–2026 GRAPH

Which statement is best supported by the graph?

Q8
📊 REFER TO: LE CANADA 1950–2026 GRAPH

What most likely explains the noticeable decline in life expectancy around 2021, especially among males?

Q9
📊 REFER TO: HALE CANADA PROVINCES 2015–2017 GRAPH

In very simple terms, what does HALE tell us?

Q10
📊 REFER TO: HALE CANADA PROVINCES 2015–2017 GRAPH

Which province had the highest HALE among the provinces shown?

Q11
📊 REFER TO: HALE CANADA PROVINCES 2015–2017 GRAPH

Which statement is best supported by the graph?

Q12
📊 REFER TO: HALE GRAPH + MEASURING HEALTH IMAGE

The HALE of Newfoundland and Labrador is lower than that of Quebec. What would be the best GHE response to this finding?

🌍

Your GHE result

0 / 12

Explore the data, think about the evidence, and try again.

REFLECT

A number can start a question.

Imagine you discover that two populations have different life expectancy or HALE.

01 What difference do you observe?
02 How confident are you that the difference is meaningful?
03 What additional information would you want?
04 What factors might help explain the difference?
05 What could be done if the difference reflects an avoidable problem?
Measure → Observe → Compare → Question → Investigate → Act
CONTINUE YOUR JOURNEY

Ready to explore another dimension of global health?

Keep exploring how evidence can help us understand people, populations and systems.